Is a 100 PageSpeed score worth it for your business?
Published · 10 min read

A fast website helps a business win customers, but a perfect score is not required to get there. Google says a good page experience “doesn’t guarantee” top rankings, and that chasing a perfect score just for SEO “may not be the best use of your time” (Google Search Central). What matters is how quickly customers can see and use your page on their phones. This guide uses our own website as a worked example, then sets out a 10-minute check you can run on yours.
Our website, tested with three tools
Summary: Google, Cloudflare and DebugBear all rate ishazam.com as fast. Because tools testing from different cities agree, the result holds across locations. This is what a well-built small business website looks like when tested.
 Google PageSpeed Insights, phone test, 13 November 2026. The desktop test also scored 100 in all four.
| Tool | Tested from | Phone score | Main content shows in |
|---|---|---|---|
| Google PageSpeed Insights | Google’s servers | 100 | 1.1 s |
| Cloudflare | Sydney | 98 | 1.9 s |
| DebugBear | USA (east coast) | 100 | 1.25 s |
Google’s “good” line for the main content is 2.5 seconds or less (Google Search Central). All tests run 13 November 2026.
Every tool places the site well inside Google’s “good” range.
What do the four scores mean?
PageSpeed Insights reports four scores out of 100, each colour-coded: 90 to 100 is green (good), 50 to 89 orange and 0 to 49 red (Chrome for Developers).
- Performance: how quickly the page appears and responds. It combines five timings, weighted most heavily towards how long the page is unresponsive while loading (30%), how quickly the main content appears (25%) and how much the layout shifts (25%).
- Accessibility: whether people with low vision or a screen reader can use it, judged on labels, contrast and button names.
- Best practices: security and code that runs without errors.
- SEO: the basics Google needs to read the page, such as a title, a description and working links.
A newer fifth check, Agentic Browsing, reports a pass count instead of a score (ishazam.com passed 3 of 3). It assesses whether AI assistants that browse on a person’s behalf can read and use the page, looking at clear labels, layout stability and an optional summary file for AI (Chrome for Developers). Google marks it as experimental.
Google’s own documentation says a perfect 100 is “extremely challenging to achieve and not expected”, so the practical target is green (Chrome for Developers).
Why is my score different every time I test?
This is one of the most common questions in website forums. One Shopify store owner reported phone scores ranging from 29 to 69, while desktop stayed between 93 and 97 (Shopify Community).
The score is based on a single simulated visit, using a set phone model and a throttled connection from one location. Network traffic, server response and advertising on the page all vary between runs (Chrome for Developers). Each of our three tools also tests from a different city with different device settings, which explains the range of 98 to 100 and 1.1 to 1.9 seconds.
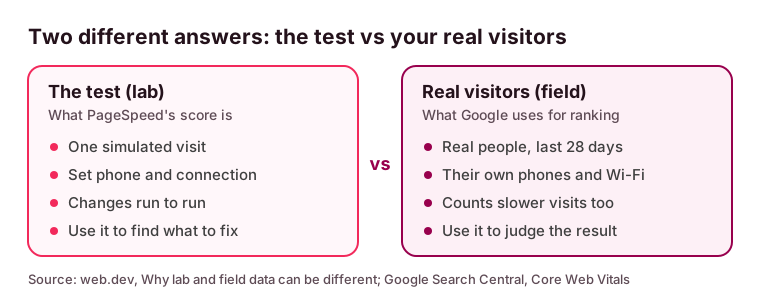
Google relies on the second measure: real-visitor data. It covers 28 days of Chrome users and is based on the slower end of their visits rather than the average (web.dev). The two measures can disagree, because a page can test slowly yet perform well for real visitors, or the reverse. Use the test to diagnose problems and the real-visitor data to confirm they are fixed.
Does my speed score affect my Google ranking?
Not directly. When the owner of a local services business asked on Reddit about an average speed score, Google Search Advocate John Mueller replied: “this is not affecting your SEO” (Search Engine Roundtable, March 2025).
Google’s published guidance makes two points:
- It uses real-visitor speed (called Core Web Vitals) as one signal among many, never the score itself (Google Search Central).
- It “always seeks to show the most relevant content, even if the page experience is sub-par” (Google Search Central).
In practice, a slower page with the most useful answer can still rank, while a fast page with thin content will not.
Why speed still matters for your business
Speed affects whether customers stay on the page and complete an enquiry or purchase. The two best-documented examples are:
- Rakuten 24, an online retailer in Japan, split its traffic 50/50 for a month between a faster page and the original, with only the speed changed. The faster page had 33% more conversions and 53% more revenue per visitor (web.dev).
- Nuvemshop, which runs more than 180,000 online stores in Brazil, took its stores with a good main-content speed from 57% to 96% in a year. Mobile sales from Google search rose 8.9% (web.dev). This was a before-and-after comparison without a control group, so other changes may have helped too.
Many agency websites quote the figure “53% of people leave after 3 seconds”. We were unable to find the original source, so it is not used here.
How do most websites score?
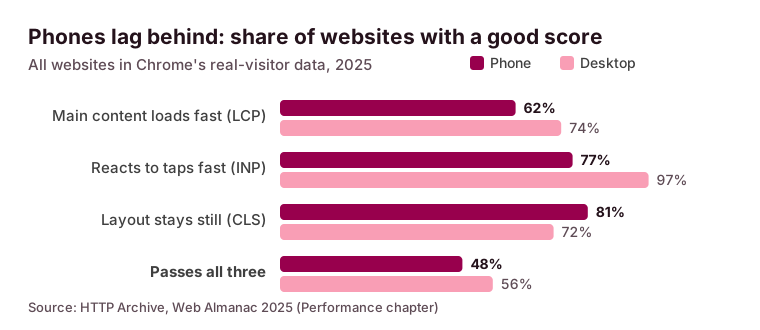
In 2025, fewer than half of websites (48%) passed all three of Google’s real-visitor checks on phones, compared with 56% on desktop (HTTP Archive Web Almanac 2025).
The website platform also plays a part. Wix, Squarespace and Square sites load the platform’s own code, which limits how far the score can be improved. One Squarespace user on the official forum remained at 30 after following a recommended fix (Squarespace Forum). Wix says a low test score “doesn’t mean your site is underperforming for real visitors” (Wix Help Center). Review your real-visitor data before paying for speed work.
Check your own site in 10 minutes
- Open PageSpeed Insights, paste your home page address and choose the Mobile tab.
- Read the top section first, “Discover what your real users are experiencing”. If it shows “No Data”, the site does not yet have enough Chrome visitors, so rely on the test results below.
- Note three numbers: main content (LCP, aim for 2.5 s or less), tap response (INP, under 0.2 s) and layout shift (CLS, under 0.1).
- Review the four scores. Green (90 or more) is good, and a score in the mid-80s does not need urgent attention.
- Run the test 3 times, and repeat it on your booking or contact page, then compare the trend.
- Open the top 2 or 3 suggestions under “Diagnose performance issues” and match them to the list below.
- Make one change at a time and test again. Real-visitor results can take up to 28 days to reflect a change.
For a plain-English second opinion, our free website checks provide a short report on what to fix first.
What to fix first
- The main image at the top of the page. This is usually the “main content” that Google measures. Resize it and avoid fade-in or slide-in effects. Nuvemshop’s fixes started with exactly this: no delayed loading and no entrance animation on the top image (web.dev).
- Unused apps and widgets. Chat bubbles, pop-ups, review widgets and tracking tags all add code; Wix notes that each app added to a page brings its own code (Wix Help Center). Remove anything that is not in active use.
- Layout shifts. Banners, images or buttons that move while the page loads cause mis-taps. Reserve a fixed size for images and embeds; Rakuten reduced its layout shift by 93% this way (web.dev).
- Mobile performance. Test on a phone first, as this is where most sites fall short (see the chart above).
- Labels on buttons and forms. Clear labels support people using screen readers, as well as AI assistants completing a booking for a customer (Chrome for Developers).
- Visibility. A fast site still needs to be found, so check whether AI assistants and search can find your business.
Prefer to have this done for you?
iShazam builds and fixes websites for small businesses, then makes sure customers can find them.
How did we get to 100?
We did not set out to reach 100. The site was built simply from the start: small images, no heavy page builder, no chat widget, few outside scripts, and a host with servers close to Australian visitors. The full home page is about 94 KB, smaller than most single photos, and the scores followed from that approach.
Where a site is slow because of how it was built, small fixes have limited effect. In that case, a rebuild or professional website review is usually the better investment.
How iShazam can help
Start with a free check, or talk to us about a fix or a rebuild.
Free tools
Services
FAQ
What is a good PageSpeed score? 90 or above is green, meaning “good”. 50 to 89 needs some work, and below 50 is poor (Chrome for Developers).
Why is my phone score so much lower than desktop? The phone test simulates a mid-range phone on a slow mobile connection, which is a much stricter test. Most sites are also slower on real phones (HTTP Archive).
PageSpeed says “No Data” for real users. Is something broken? No. Google needs enough Chrome visitors over 28 days before it shows real-visitor results (Google). Smaller sites often see “No Data”. Sites that run through Cloudflare can use its free real-visitor report in the meantime.
Do GTmetrix or Pingdom scores count for Google? Google does not use any testing tool’s score. Each tool has its own settings, so choose one, use it consistently and track the trend.
Should I pay someone to get my score to 100? Usually not. Reach the green range and fix the issues real visitors notice, then direct the remaining budget to visibility and enquiry follow-up.
Summary
- Google uses real-visitor speed as one signal among many and does not use the PageSpeed score itself.
- Faster pages convert better, especially on phones.
- Test on mobile, read the real-visitor data first, address the main image and unused apps, then test again.
Sources
- Google Search Central, Understanding page experience in Google Search results (undated). https://developers.google.com/search/docs/appearance/page-experience
- Google Search Central, Understanding Core Web Vitals and Google search results (undated). https://developers.google.com/search/docs/appearance/core-web-vitals
- Chrome for Developers, Lighthouse performance scoring (undated). https://developer.chrome.com/docs/lighthouse/performance/performance-scoring
- Chrome for Developers, Lighthouse Agentic Browsing scoring (2026). https://developer.chrome.com/docs/lighthouse/agentic-browsing/scoring
- web.dev, Why lab and field data can be different (undated). https://web.dev/articles/lab-and-field-data-differences
- Google, About PageSpeed Insights (undated). https://developers.google.com/speed/docs/insights/v5/about
- web.dev, Rakuten 24 case study (undated). https://web.dev/case-studies/rakuten
- web.dev, Nuvemshop case study (24 June 2026). https://web.dev/case-studies/nuvemshop
- HTTP Archive, Web Almanac 2025: Performance. https://almanac.httparchive.org/en/2025/performance
- Search Engine Roundtable, Google: Poor Pingdom score does not affect your SEO (26 March 2025). https://www.seroundtable.com/google-seo-poor-pingdom-score-39131.html
- Wix Help Center, Understanding PageSpeed Insights (undated). https://support.wix.com/en/article/site-performance-understanding-pagespeed-insights
- Shopify Community, Why does my mobile speed score keep fluctuating? https://community.shopify.com/t/why-does-my-mobile-speed-score-keep-fluctuating/75918
- Squarespace Forum, Page speed insights performance issues. https://forum.squarespace.com/topic/239193-page-speed-insights-performance-issues-help/
- Our own tests of ishazam.com, 13 November 2026: Google PageSpeed Insights, Cloudflare (Sydney), DebugBear (US east).